Overview Report
- Overview Report: Overview and Functions
- Filters
- Overview Report Metrics
On the homepage of Babkee, you’ll find the Overview Report.
This report provides general information about advertising campaigns, including data on costs, profits, and revenue for a selected period.
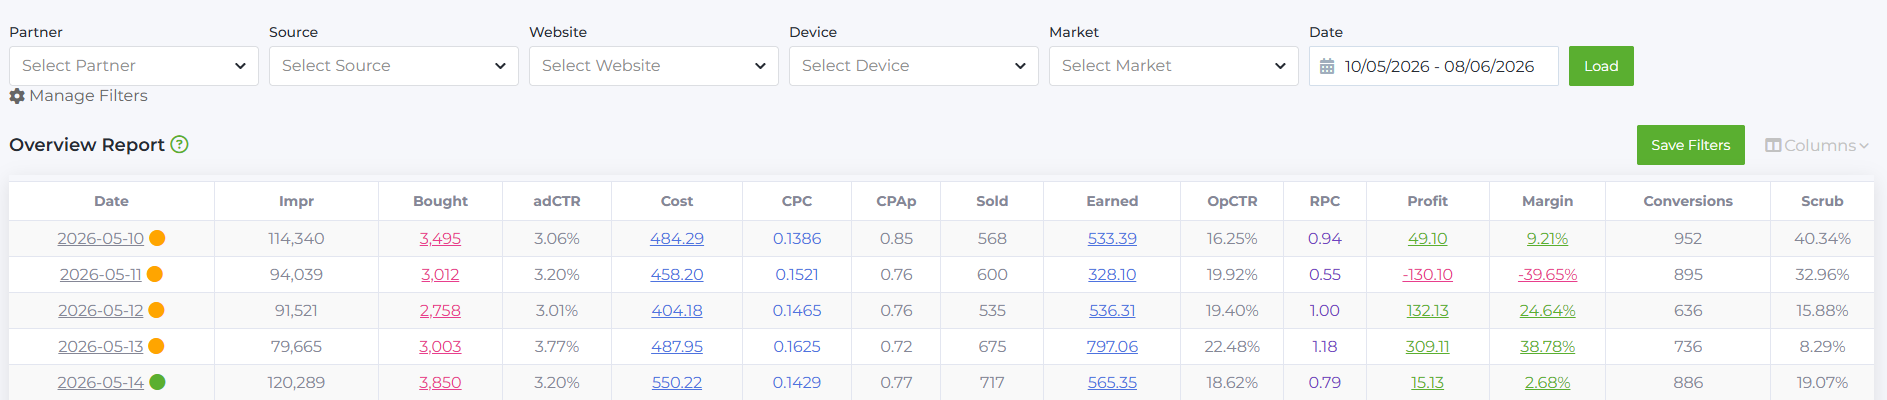
Campaign statistics in Babkee become available by midday the next day after the campaign is launched (in the GMT time zone). Each partner has their own statistics collection time. You can check the time zone your partner operates here.
To check whether the statistics have been collected or not, look at the colored circle next to the date in the Date column.
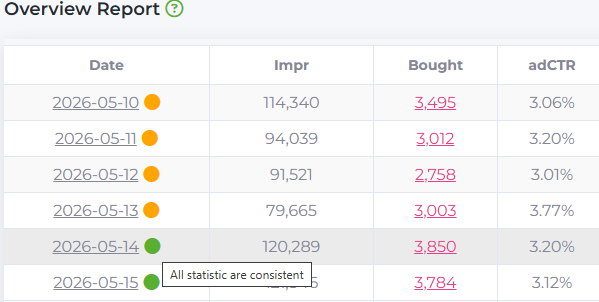
- Green – All statistic are consistent
- Yellow – Some statistics are inconsistent
You can hover over the circle to see a tooltip.
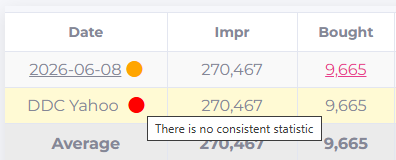
In the detailed statistics, you can see the statuses for partners and sites. In addition to the statuses mentioned above, a red circle may be displayed — it means that the statistics for that partner or site are missing.
Filters
At the top of the report, you’ll find filters for the following parameters:

In the detailed statistics, you can see the statuses for partners and sites. In addition to the statuses mentioned above, a red circle may be displayed — it means that the statistics for that partner or site are missing.
- Partner: list of partners to whom we sell traffic (e.g., Yahoo).
- Source: list of traffic sources from which we purchase traffic (e.g., Google Ads).
- Websites: list of websites where the traffic is directed.
- Device: list of devices to which the traffic is directed.
- Market: list of countries (also referred to as "market" or "geo") where the ads are placed. Countries are labeled according to their international abbreviations.
- Buyer: list of buyers registered in the system.
- Date: the period for which the statistics are displayed.
- Link Format: a list of URL templates (advertising links) with dynamically supplied parameters. This filter is required when working with the Yahoo partner to evaluate traffic for 2-click and 1-click MMG Yahoo.
- Ad Format: the format of the advertisement (different for each source).
You can hide unnecessary filters by clicking Manage Filters:
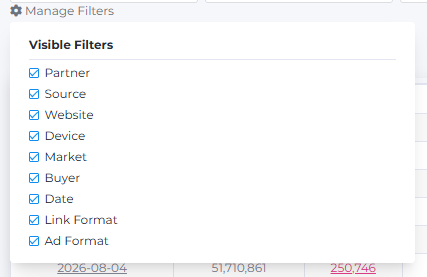
In each field, you can select one or several parameters from the dropdown list. For quick navigation, each list includes a Search field. You will only see the parameters that you have access to.

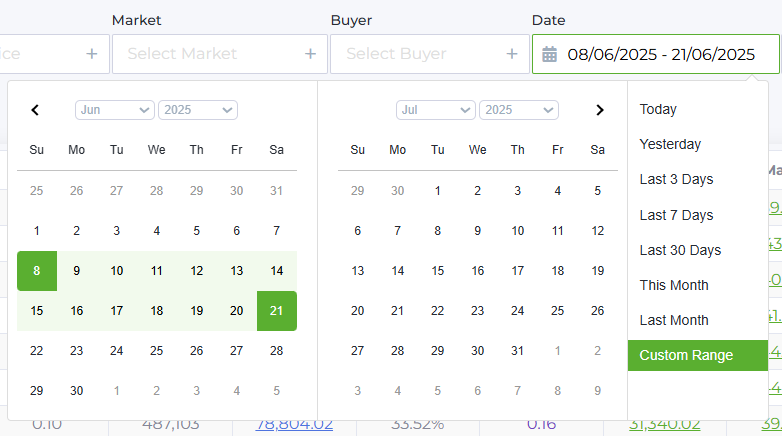
The Date filter contains a convenient calendar where you can choose the required time range from the list on the right or set your own by clicking on the dates:
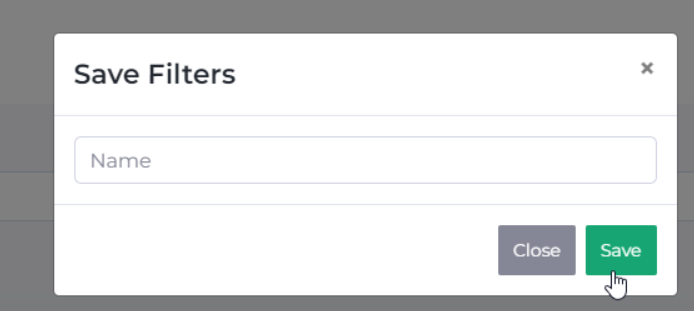
After selecting the necessary parameters, you can save the filter for quick access. To do this, click Save filters, enter the filter name, and click Save.

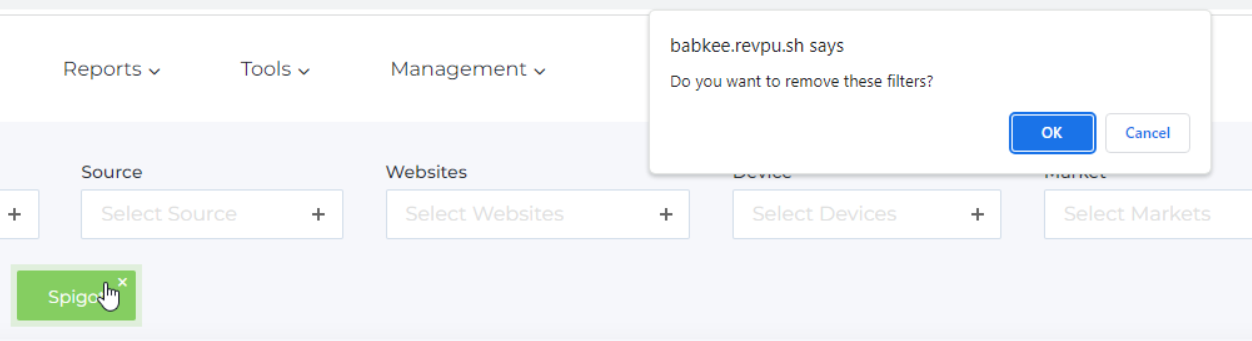
If you need to delete a filter, click the cross icon in its upper right corner and confirm your choice:
Overview Report Metrics
The Overview Report represents a table with detailed daily statistics. To view statistics for a specific day, select it in the Date filter and click Load. The report will generate daily statistics based on selected metrics.
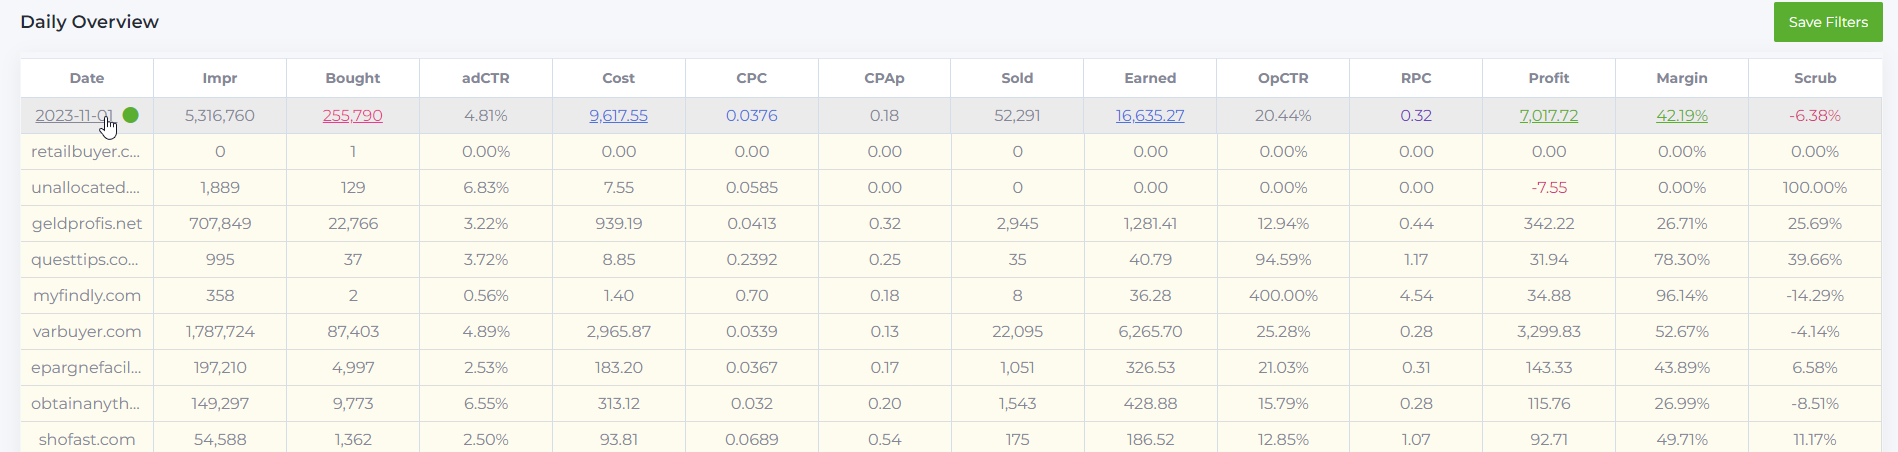
The left side of the metrics relates to traffic acquisition (Impr, Bought, adCTR, Cost, CPC, CPAp). The right side relates to traffic sales on the partner’s website (Sold, Earned, OpCTR, RPC, Profit, Margin, Scrub).
Let’s break down what each column in the table represents:
- Date: the day for which the report is generated. By clicking on the date, you can view detailed statistics on the websites where traffic was directed.
- Impr: the number of ad impressions.
- Bought: the number of clicks purchased. Clicking on this metric in the expanded statistics allows you to see the distribution by device for the day (desktop, mobile, etc.).
- adCTR: the average click-through rate (CTR) for the day. This is an indicator of ad quality—the more appealing the ad, the higher the adCTR. This metric considers only those users who clicked on the ad in the source, such as Google Ads.
CTR (Click-Through Rate) shows the ratio of users who clicked on the ad to those who saw the ad. The prefix "ad" indicates that this CTR is related to the advertising campaign on the source.
adCTR = 100% x Bought / Impr
- Cost: the amount spent on purchasing ads for the day. Clicking on this in the expanded statistics allows you to see the cost distribution for each source.
- CPC (Cost Per Click): the cost of one purchased click (Bought) within the traffic source.
CPC = Cost / Bought
- CPAp (Cost Per Action partner): the average cost per action on the partner’s side (click on the site via the ad link), taking into account unpaid traffic (scrub).
CPAp = Cost / Sold
- Sold: total number of clicks sold for the day.
- Earned: total revenue for the day. Clicking on this in the expanded statistics allows you to see the revenue distribution for each partner.
- OpCTR: the on-page click-through rate. This is the average CTR on the target site for the selected period. The prefix “Op” stands for “on page,” meaning it considers users who clicked on the ad on the site.
opCTR = Sold / Bought x 100%
- RPC (Revenue Per Click): the average revenue earned from each sold click (Sold) for the selected period.
RPC = Earned / Sold
An ad campaign is considered successful if RPC significantly exceeds CPA.
- Profit: net profit for each country for the selected period. Clicking on this in the expanded statistics allows you to see the profit distribution by markets (countries).
Profit = Earned - Cost
- Margin: the average margin for each country for the selected period. Clicking on this in the expanded statistics allows you to see the margin distribution by buyers.
Margin = Profit / Earned x 100%
- Scrub: the percentage of unpaid traffic, i.e., traffic that was removed from the campaign’s statistics for various reasons, such as suspicion of fraud, poor-quality clicks, or failure to meet specified criteria. This scrubbing process is conducted to improve data quality and ensure more accurate analytics.
Scrub = (1 - Sold / Conversions) х 100%
This metric can have three values: positive, negative, or zero.
Positive value indicates that the number of conversions exceeded the number of sold clicks. This difference is removed by the partner (possibly due to dissatisfaction with traffic quality, bots, etc.). Time differences can also impact this value.
Negative value indicates that the number of sold clicks exceeded the number of conversions. This can happen if one user made multiple clicks on the ad link, or due to tracking limitations or bots that bypassed anti-bot measures.
Zero value indicates that the number of conversions equals the number of sold clicks, suggesting no discrepancies between sold clicks and actual conversions. In reality, it is almost never exactly zero, and that’s normal.
- Clicks: the total number of actual clicks on the ads.
- Passed Clicks: the number of actual ad clicks that passed our bot detector check.
- cScrub: the percentage of actual clicks that were filtered out by our bot detector.
cScrub = ((Clicks - Passed Clicks) / Clicks) * 100%
- pScrub: the percentage of actual clicks that passed our bot detector but were not counted by Yahoo.
cScrub = ((Passed Clicks - Sold) / Passed Clicks) * 100%
At the bottom of the table, you can see the Average and Total values for the report metrics. Total values are calculated for Impr, Bought, Cost, Sold, Earned, and Profit.
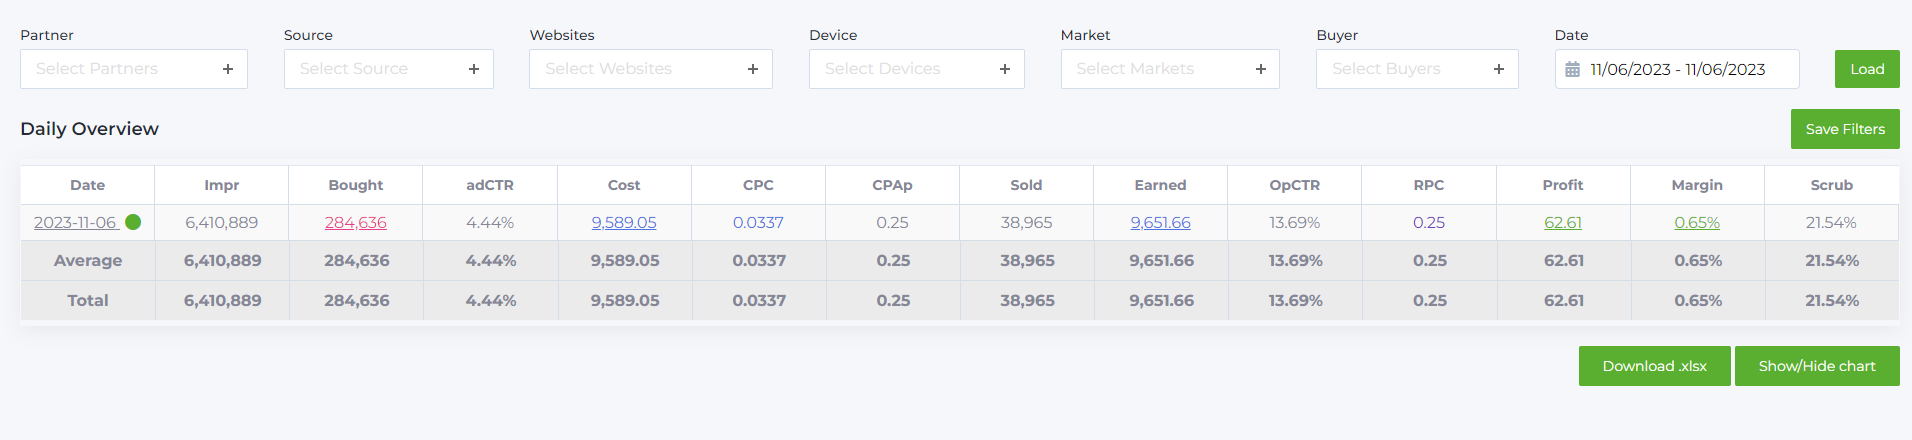
You can export the report data to an .xlsx file by clicking the Download .xls button.
Below the table, you can find a chart to display visual statistics. To open the chart, click on the Show/Hide chart button:
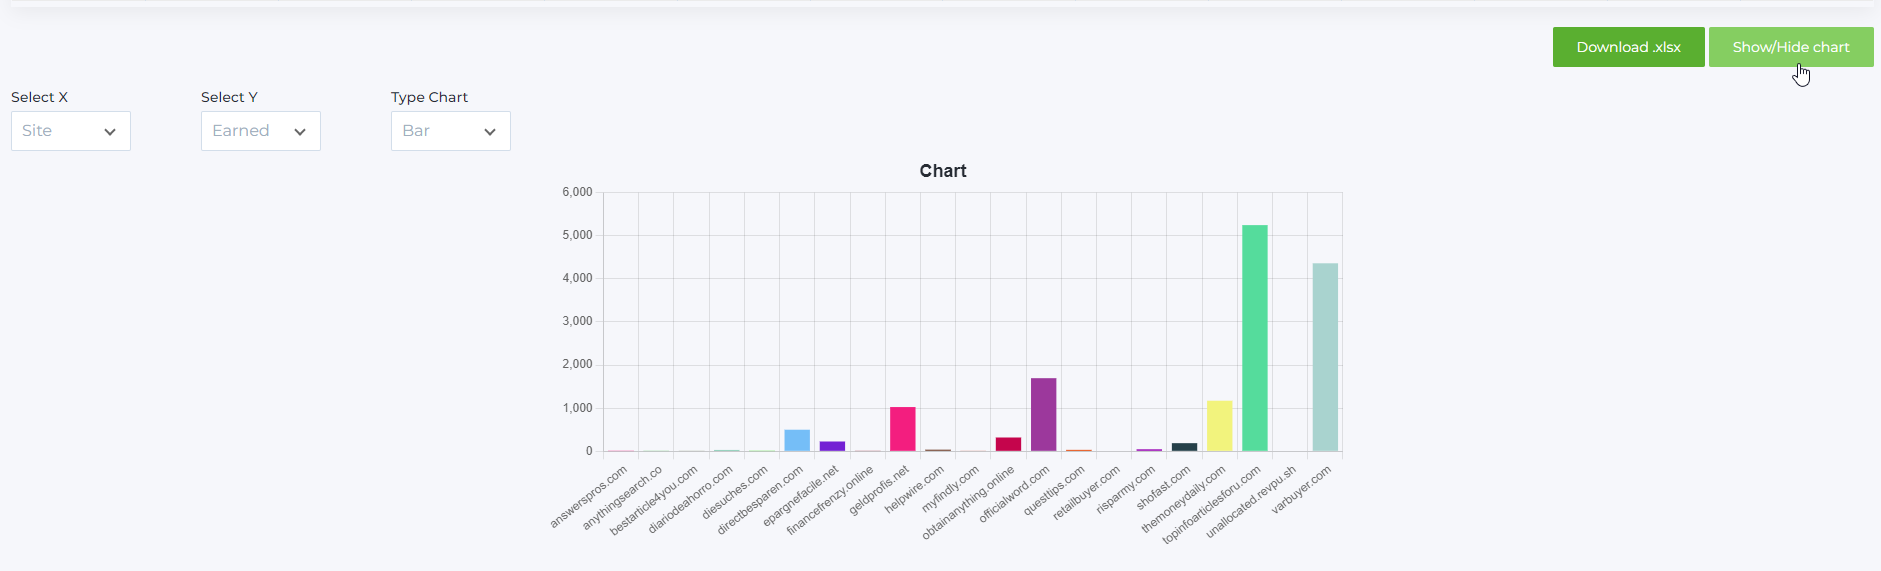
The following parameters are available for creating the chart.
For the X-axis (abscissa):
Site
Device
Partner
Market
Source
Buyer
Period
For the Y-axis (ordinate):
Impressions
Purchased
Costs
Sold
Revenue
Profit
Types of charts available:
Vertical (bar chart)
Circular (pie chart)
Line
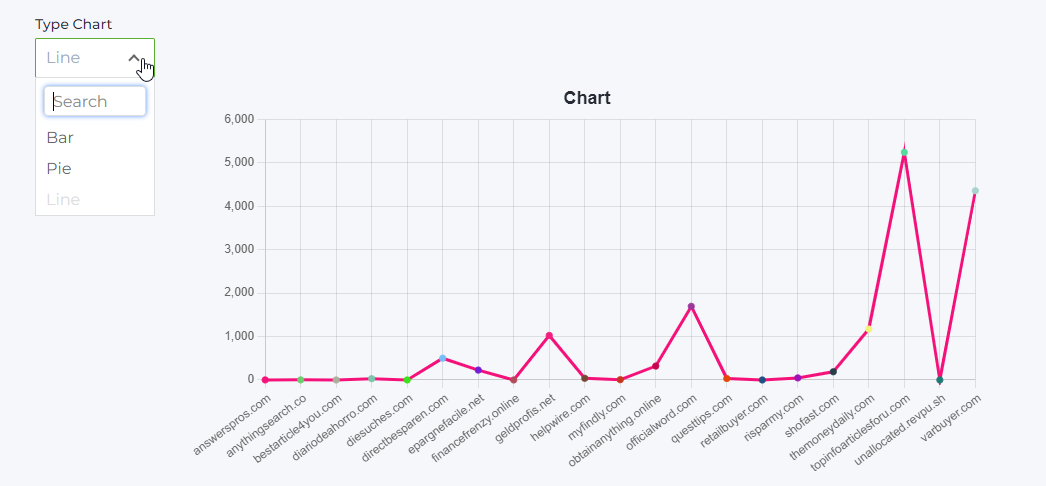
Select the desired chart type from the dropdown list:
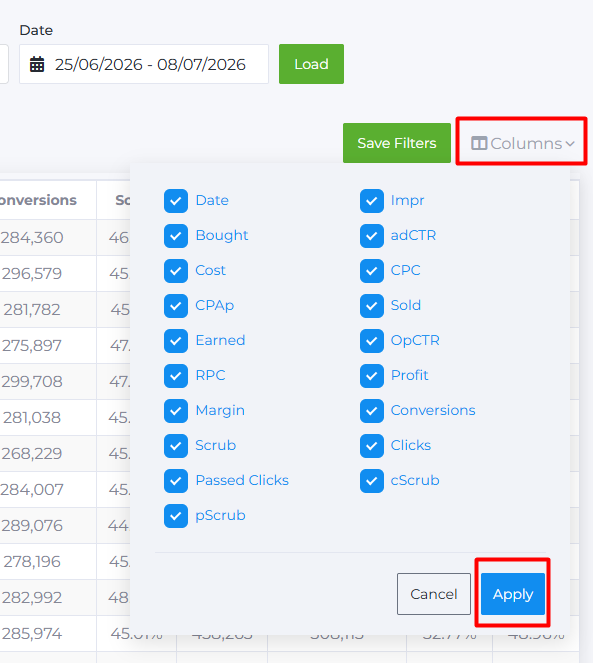
To choose which columns are displayed in the report and which are hidden, click on Columns, select the columns you want, and then click Apply. Columns that are not checked will be automatically hidden from the report.