
Country Report provides statistics by source traffic countries. This report is aggregatted together with Overview Report for every partner, respectively. You can see statistics aggregation time for every partner in Partner Info documentation.

To launch the report, open the Reports dropdown menu and select Country Report from the list:

FILTERS
You can customize the report with the following filters:
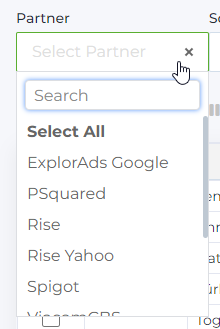
Partner - A list of partners with whom we collaborate.
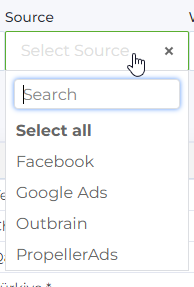
Source - A list of traffic sources.
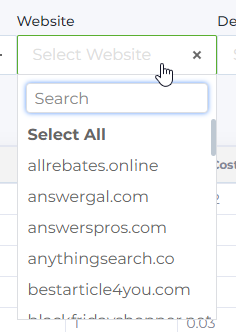
Websites - A list of targeting websites.
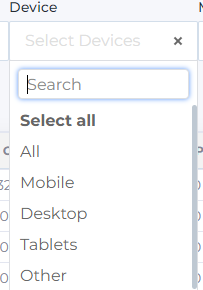
Device - A list of targeting devices.
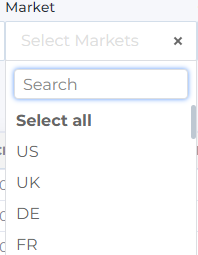
Market - A list of targeting countries (also referred to as ‘market’ or ‘geo’).
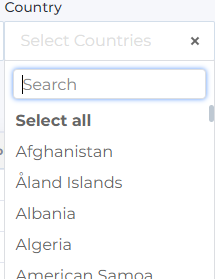
Country - A list of targeting countries.
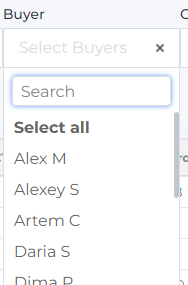
Buyer - A list of buyers registered in the system.
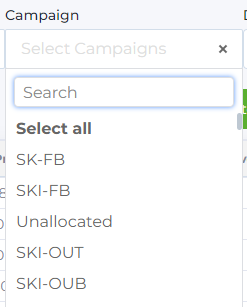
Campaign - A list of advertising campaigns. In Babkee system campaign is like a folder storage assigned to every buyer. The folder contain buyer’s ad groups.
Date - Statistics display period.
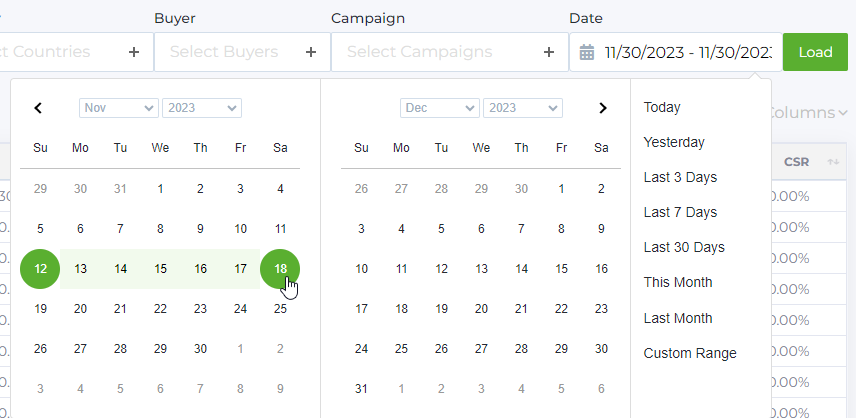
In these fields, you can select one or several parameters and save your custom filter for quick access. Choose the necessary parameters in the dropdown lists and click Save filters:

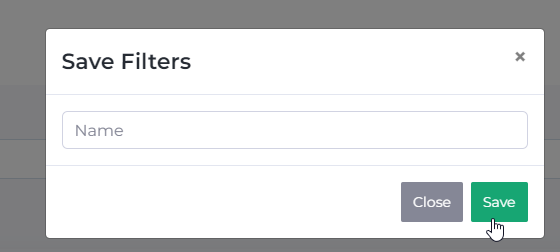
Enter filter name and click Save:
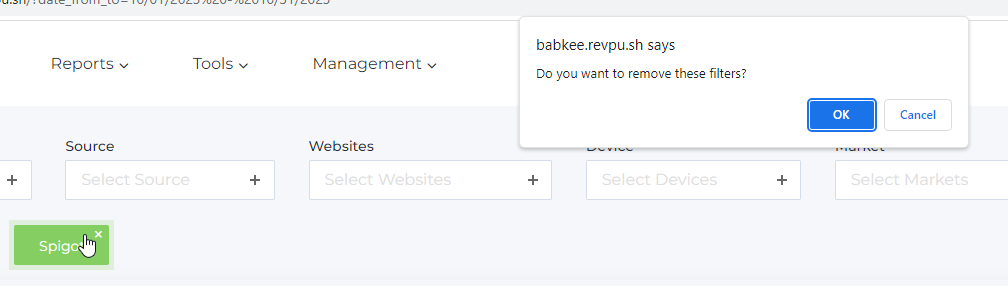
To remove filter, click on the cross in its upper right corner and in the pop-up window, and click OK.
REPORT CONTENTS
Let's take a detailed look at the list of metrics that make up the report.
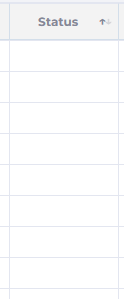
Status column - The status is visible when searching for a specific advertising campaign. When selecting "all," the status field is empty.
Country column - the name of the source country.
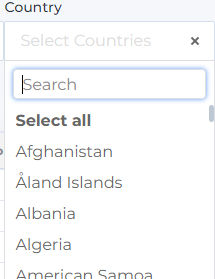
When you click on the country, a daily report opens with statistics for the selected country for the last week.
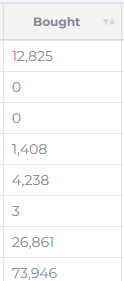
Bought column - the number of clicks purchased. It contains information on the number of clicks purchased for each country during the selected period.
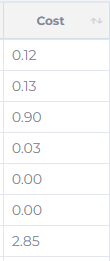
Cost column (USD) - the amount spent on advertising for each country during the selected period.
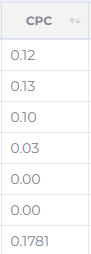
CPC column (Cost per click, USD) - the cost of one purchased click (Bought) for one country within the traffic source. Calculated as: Cost / Bought.
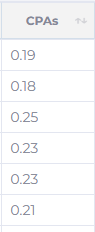
CPAs column (Cost per action, s - Source, USD) - The average CPA in traffic source. Calculated as: Cost / Conversions.
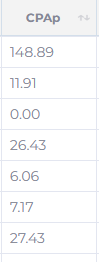
CPAp column (Cost per action, USD) - the average CPA from the partner, taking account of the scrub.
It represents the cost of one target action (click on our website on an advertising link). Calculated as: Cost / Sold.
Sold column - Total number of clicks sold in the selected period for each country.

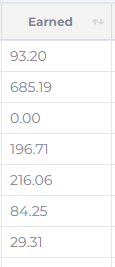
Earned column (USD) - represents the total revenue for each country over the selected period.
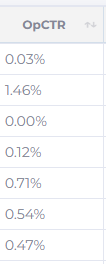
opCTR column (On page click-through rate, %) - the average CTR on the target website for the selected period. The prefix “Op” means “on page", that is, on the page, users who clicked on the ad on the site are counted here. Calculated as: Sold / Bought * 100%.
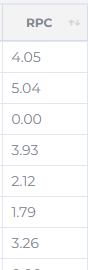
RPC column (USD) - The average revenue earned from each sold click (Sold) over the selected period. Calculated as: Earned / Sold.
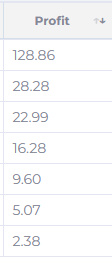
Profit column (USD) - The net profit for each country over the selected period. Calculated as: Earned - Cost.
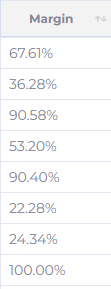
Margin column (%) - The average margin for each country over the selected period. Calculated as: Profit / Earned*100%.
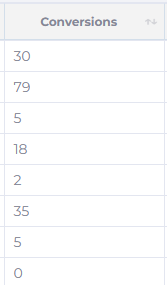
Conversions column - The number of conversions for each country over the selected period. These are the visitors who have completed a target action, such as clicking on a link in the search results and landing on the advertiser's page.
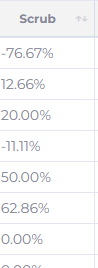
Scrub column (%) - The level of scrubbed traffic for each country over the selected period. Calculated as: (1 - Sold / Conversions)*100%.
This metric can take three values: positive, negative, or zero.
A positive value indicates that the number of conversions exceeded the number of sold clicks. The difference is scrubbed by the partner (perhaps due to dissatisfaction with the traffic quality, bots, etc.). Time zone differences can also affect this value.
A negative value suggests that the number of sold clicks exceeded the number of conversions. Potential factors include a single user making multiple clicks on advertising links, restrictions on tracking advertising actions, or bots that managed to bypass anti-bot measures.
A zero value indicates that the number of conversions is equal to the number of sold clicks, implying no discrepancy between sold clicks and actual conversions.
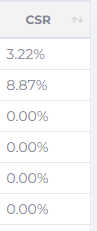
CSR column (%) - Applicable to partners operating via 2-Click flow model. It displays the percentage of clicks that the partner has identified as being generated by bots. This ratio is important for evaluating the quality of traffic and determining the extent of non-genuine, or spammy, click activity within a campaign.
Searches column - represent the total number of times a search query is made.

Bidded Searches column - the total number of searches for which sponsored listings were displayed.

Coverage column - the percentage of searches for which sponsored listings are returned. Simply put, of all the Searches you sent, what percentage were “filled” with impressions (Bidded Searches). Calculated as: Bidded Searches / Searches.

Clicks – the total number of actual clicks on the ads.
Passed Clicks – the number of actual ad clicks that passed our bot detector check.
cScrub – the percentage of actual clicks that were filtered out by our bot detector. Calculated as: ((Clicks - Passed Clicks) / Clicks) * 100%.
pScrub – the percentage of actual clicks that passed our bot detector but were not counted by Yahoo. Calculated as: ((Passed Clicks - Sold) / Passed Clicks) * 100%.
At the bottom of the table, you can see a weighted average and total values for report parameters. Total values are calculated for Bought, Cost, Sold, Earned, Profit, and Conversions metrics.
The weighted average values take into account the proportionate contribution of each parameter across different countries or segments to give a more accurate representation of the overall performance. The total values are simply the sum of each individual metric across all countries or segments, providing a cumulative figure for the selected period.

Below you can see the total number of countries in the report for the selected period and the number of campaigns displayed on the page are indicated. If necessary, the number of displayed items can be changed (select 10, 25, 50, 100, or all items).
GROUP OPERATIONS
The report allows you to interact with the data: copy countries, pause or start serving by country within a campaign, and open a detailed report for selected countries.

To make changes, select one or several countries from the list by checking the box next to them. In the field above, select the desired action:
- Copy Countries – copies the countries you’ve checked
- Copy Active Countries – copies all active countries, if they have the status
- Pause – pauses delivery for the selected country(ies)
- Start – resumes delivery for the selected country(ies)
- Open Countries – opens detailed AdGroup Country Report for the selected country(ies) in a new tab (if it doesn’t open, enable pop-ups in your browser)
AdGroup Country Report lets you bulk-pause and resume countries across all ad groups. To do this:
- In Country Report, set your filters (Partner, Source, Website, Buyer, Date) and select the desired countries.
- Check the boxes next to the countries you want and click Open Countries button.
- AdGroup Country Report will open in a new tab, listing all ad groups using those geos. Here you can pause or start display for those countries across all ad groups with a single click. (If the report doesn’t open, please enable pop-ups in your browser.)

The report also supports search by ad group. You can paste the ad group name in the search field at the right top of the page and get statistics for that selected ad group only:

FILTER SETUP
In addition to configuring standard filters to load data above the report, you can set up extra filters for specific data display. Press the Filters button above the report to access them:
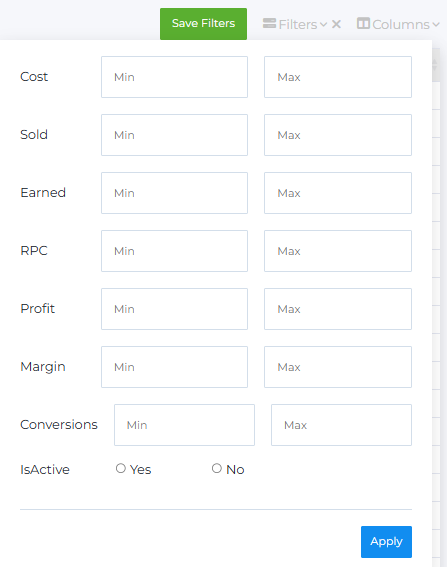
Available parameters for filter setup:
- Cost
- Sold
- Earned (Revenue)
- RPC (Revenue per Click)
- Profit
- Margin
- Conversions
- IsActive (Selection of only active or inactive campaigns)
You can also choose which columns are displayed in the report and which are hidden. To display columns, you need to mark them in the list and then click Apply. Columns that are not marked will be automatically hidden from the report.

You can download the report by exporting it to .xlsx format. Press Download .xlsx button to start download.
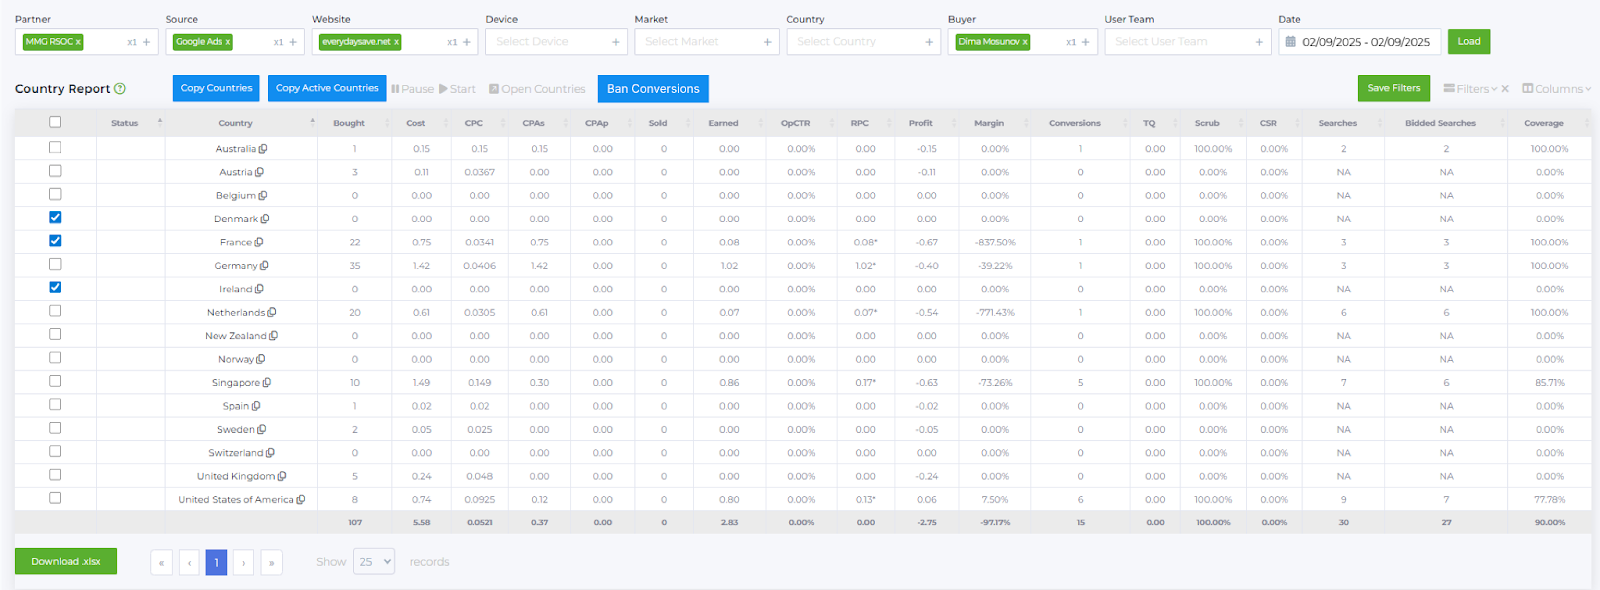
NOTE! When navigating from AdGroup Report or AdGroup Daily Report to Country Report, Ban Conversions and Unban Conversions buttons have been added.
This feature is designed to block countries in Google Ads in order to bypass the exclusion limit of 122 countries. By using Ban Conversions button, Google stops receiving conversion data from the selected countries within your campaign. This allows Google's system to relearn and stop sending traffic from those countries.
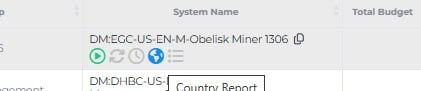
To prevent conversion tracking for selected countries, check the corresponding country checkboxes and click Ban Conversions button.
Country statuses are displayed by color:

- Green – country is active, conversions are being tracked.
- Gray – country is stopped.
- Purple – conversion tracking for the country is blocked using Ban Conversions. To restore conversion tracking, click on the purple status to change it back to green, or select the country via the checkbox and click Unban Conversions button.